I Revolution!
Animals
Pets
Life Tips
Home & Garden
Cooking
Beauty
Work
Fashion
Relationship
Tech
Travel
Money
Investment
Food & Drinks
More
Education
Entertainment
Culture
Science
Anime
Fitness
Industry
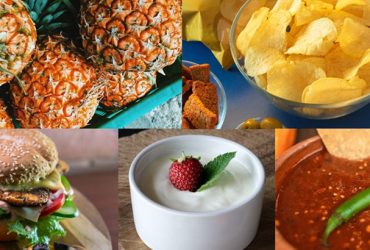
What to Eat with Braces the First Week: 30 Foods and Drinks
91 Trivia Questions and Answers for Seniors That They Will Enjoy
34 Foods That Cause Canker Sores and How to Stop Getting One
Top 5 Most Dangerous Roller Coasters in the World
5 Creative Ways to Announce Pregnancy to Your Family in Person
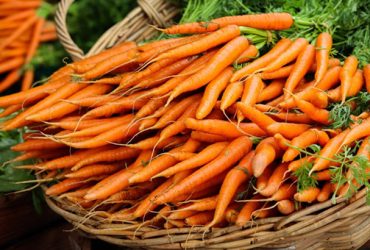
Myth Bust: Are Carrots Actually Good For Your Eyes?
Not Just a Cleanse: The Benefits of Fasting for 3 Days
365 Creative Toastmasters Table Topic Questions
9 Best Ways to Kick Start Weight Loss
1
2
3
…
94